Understanding the Financial Impact of Data Science Projects
Written on
Evaluating the Value of Data Science Initiatives
In the realm of data science, there is a significant emphasis on a variety of performance metrics. Data scientists often devote considerable time to enhancing these metrics for their projects. However, the primary concern remains whether these efforts genuinely translate into value. Solely relying on performance metrics fails to reveal whether the model's worth is actually increasing.
Performance metrics do not indicate the true value of predictions. For instance, the F1 score assigns equal importance to both precision and recall; nonetheless, the business implications of false positives and false negatives usually differ.

Knowing how well a model performs can be assessed through numerous metrics, but none answer the crucial question from stakeholders: What is the actual business value?
Defining Business Value
Ultimately, for a profit-driven enterprise, business value equates to financial gain.
Business Value = Monetary Value
This revelation is promising for data scientists, as they thrive on numbers. Financial figures are quantifiable, facilitating analysis.

However, establishing a direct link between the project outputs and the financial value can be complex. One effective method to relate a data science project to business performance is to estimate the impact of implementing that model on the company’s profitability. Although this may not always be feasible, it serves as a valuable exercise to identify areas where the connection is clearer.
A Practical Illustration of Business Value Calculation
Consider a scenario where we develop a model aimed at identifying manufacturing defects in a factory producing widgets.

If a defective widget is detected, it is discarded, leading to a loss equivalent to its production cost, which is $100. Conversely, if a defective widget is not detected, it is shipped to a customer, necessitating a replacement and incurring a shipping cost of $50, in addition to the $100 loss for the defective item.
By utilizing a predictive model for defective widgets, we can outline the costs associated with various outcomes:
- True Positives: -$100 (loss of a widget)
- False Positives: -$100 (cost of replacing a non-defective widget)
- True Negatives: $0 (considered the baseline scenario)
- False Negatives: -$150 (cost of replacing a defective widget)
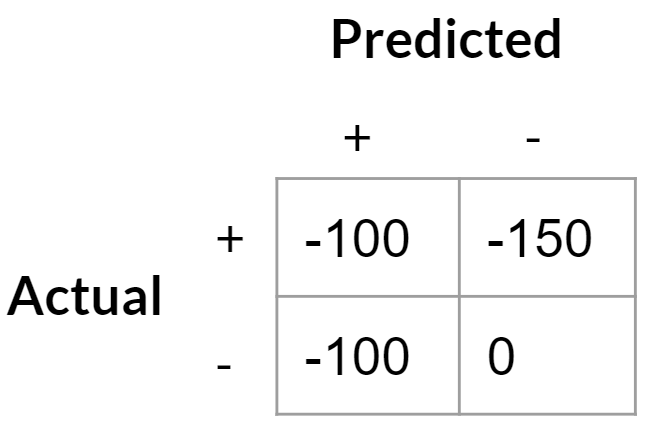
This can be framed as saying the cost of a false positive is $100 (the difference between a false positive and a true negative) while a false negative costs $50 (the gap between a false negative and a true positive).
By constructing a classifier, we can calculate the costs associated with defects if we adopt this classifier for screening. The business value evaluation of the model becomes straightforward—producing a confusion matrix based on a test set is essential.
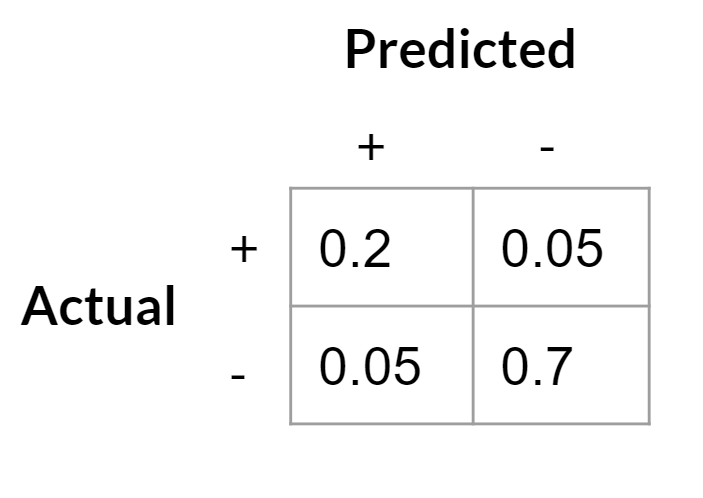
Next, we calculate the expected cost by multiplying the cost of each outcome by its occurrence rate:
(-100 * 0.2) + (-100 * 0.05) + (-150 * 0.05) + (0 * 0.8) = -32.50.
This indicates that, on average, each widget results in a loss of $32.50 due to defects when using this model. In comparison, if we assume no defect screening, with 25% of the widgets being defective, the cost per widget under the current policy would be:
-150 * 0.25 = -37.50.
Thus, employing our model to filter out defective widgets would yield a saving of $5 per widget.
This analysis illustrates the business value of our model. However, it's crucial to consider that in reality, implementing new policies may incur additional costs, which should be weighed against the calculated benefits.
Adjusting for Asymmetric Costs
With a clearly defined cost matrix, we can refine our model to minimize expenses further. Most classifiers default to a probability threshold of 0.5 for labeling positive or negative outcomes, but this may not be optimal in the presence of asymmetric costs.
In our scenario, false negatives are less costly than false positives ($100 for false positives versus $50 for false negatives), suggesting a higher optimal decision threshold; we should be more inclined to accept false negatives.
Here’s a simple simulation of the cost curve based on our cost matrix (the minimum on this curve is around 0.7, indicating our optimal threshold):
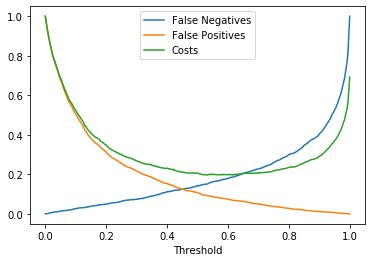
Accordingly, we should classify any prediction with a probability above approximately 0.7 as defective and label others as non-defective.
Modifying the Cost Matrix
It’s vital to recognize that changes to the cost matrix can significantly influence both the business value of the model and the optimal decision threshold. For example, if a company develops a costly but definitive test for defective widgets at $20, this alters the cost matrix considerably:
- True Positives: -$120 (the production cost plus the test)
- False Positives: -$20 (cost of the definitive test that confirms good widgets)
- True Negatives: $0 (again, the default scenario)
- False Negatives: -$150 (cost of shipping replacements)
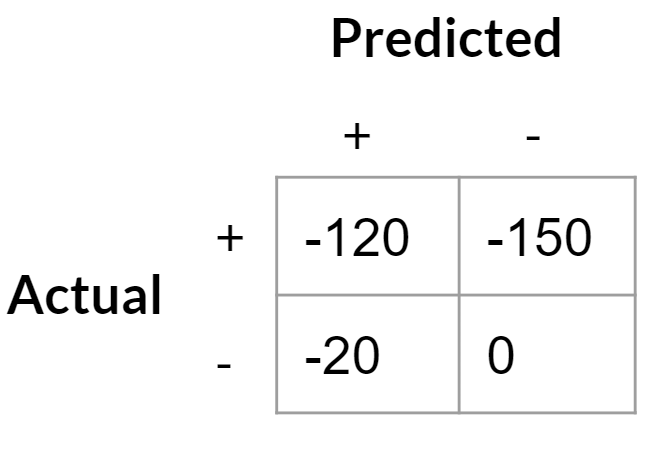
As the cost of a false positive decreases, the payoff curve shifts. We should become more accepting of false positives since they are now less expensive, while false negatives remain costly.
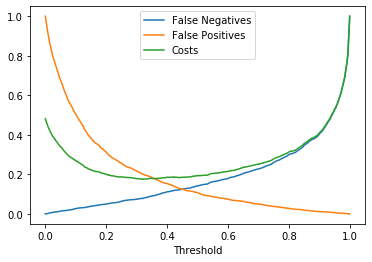
The optimal decision threshold for minimizing costs has now dropped to around 0.3. This means we will classify more widgets as potentially defective, which is acceptable since they will undergo further testing rather than being discarded. We can assess the total costs of this policy and compare it to alternatives, such as applying the $20 test to every widget.
Generalizing to Complex Scenarios
In real-world applications, defining a business problem with such clarity is uncommon. The complexity of actual costs and the intricacies of classification problems often obscure the connection to business value. However, by analyzing simpler cases, we can gain insights into more complex scenarios. Identifying ambiguities or gaps in project definitions is the first step toward clarifying the problem and connecting it to a technical solution that maximizes business value.
The first video, "Data Science Projects: How to Stand Out (Part 1)" discusses strategies for distinguishing your data science projects in a competitive field.
The second video, "Leading Data Science Teams for Business Value" explores the leadership skills required to drive data science projects that deliver tangible business benefits.