The Evolution of Graph Theory: From Bridges to Social Media
Written on
Chapter 1: The Roots of Graph Theory
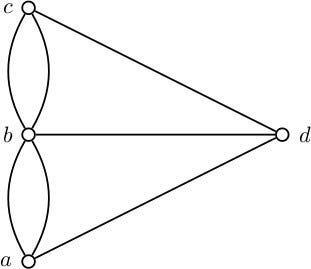
In the early 18th century, the citizens of Königsberg, Prussia, faced a unique challenge. They were presented with the question of whether it was possible to traverse all seven bridges in the city without crossing any bridge more than once. The reason behind this curiosity may be lost to time; perhaps it was a quest for the most economical route or simply a fascination with their infrastructure. Regardless, the resolution to this puzzle gave birth to a mathematical discipline essential to modern social networks.
The mathematician Leonhard Euler tackled this issue with fervor, simplifying it to its core essence. The challenge was less about the physical bridges and more about a conceptual graph: could one connect points without retracing any steps?

The conclusion was a resounding no—attempting it would prove futile. This insight laid the groundwork for graph theory, a field that underpins every interaction we have on platforms like Facebook and Twitter today.
Section 1.1: Understanding Graphs
While many people have a general idea of what a graph represents, in mathematics, it has a specific definition that helps clarify rules and calculations necessary for problem-solving. At its most fundamental, a graph consists of two sets. The first, known as the vertex set, includes distinct entities, which could be individuals or even infrastructure elements. For example, consider a vertex set comprising John, Alex, Somesh, and Lily. The second set, the edge set, consists of pairs of vertices that signify connections between them. If the pair {John, Lily} is in this set, then John and Lily are linked.
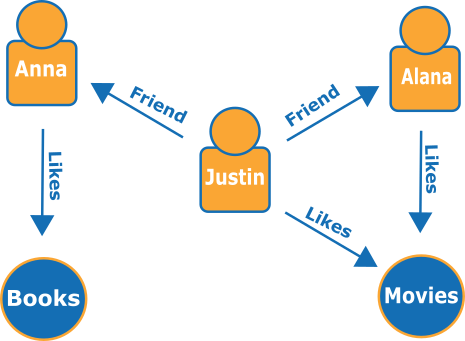
Visual representation often aids in understanding these concepts. Below is a graph that illustrates elements of social connections:

Can you identify the vertex and edge sets in this representation? (The answer is provided at the conclusion of this article).
Subsection 1.1.1: Various Types of Graphs
The definition of graphs can be refined to create specific categories. Here are some notable types, along with their practical applications:
- Digraphs or Directed Graphs: In these, edges have directionality. For instance, the edge (Justin, Movies) is distinct from (Movies, Justin), highlighting the asymmetry in relationships—following someone on Twitter exemplifies this.
- Multigraphs: These allow for multiple edges between two vertices, useful in scenarios like airline route maps where numerous flights may connect two cities.
- Pseudographs: These permit edges that loop back to the same vertex, applicable in unique situations, such as tracking office coffee orders.
- Complete Graphs: These contain every possible connection among vertices, serving as a mathematical benchmark.
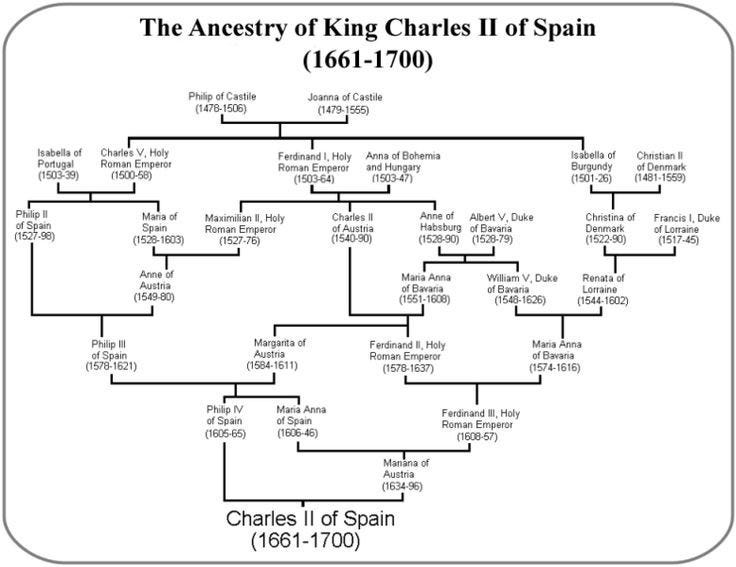
- Trees: Defined as connected graphs without cycles, trees can depict family relationships, although certain royal lineages may complicate this analogy!

Each of these graph types serves specific real-world challenges, with graphs, digraphs, and multigraphs being particularly relevant in data science.
Section 1.2: The Adjacency Matrix
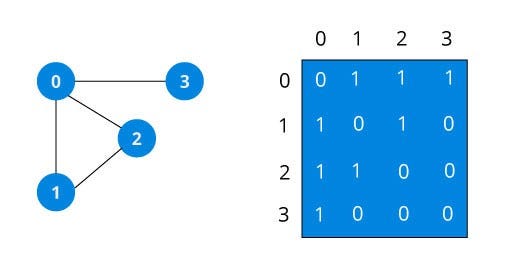
Before concluding, it's vital to discuss the adjacency matrix, a powerful tool for quantifying network phenomena. In scenarios with numerous vertices, graphical depictions can become cumbersome, necessitating a more organized notation system. An adjacency matrix is a square array with vertex names along both axes, where 1’s and 0’s indicate the presence or absence of edges.

The properties of the adjacency matrix vary depending on the graph type. For instance, basic graphs have symmetrical matrices, while directed graphs do not. These matrices are instrumental; squaring an adjacency matrix reveals the number of paths of length two between vertices, and raising it to the nth power uncovers paths of length n.
Graph theory offers rich mathematical insights with practical applications across various fields, including people analytics, medicine, and sociology. Open questions abound: How can social networks improve emergency responses? What influence do they have on political dynamics? Can they assist in tracking disease spread?
In future articles, we will delve deeper into how to apply graph theory for assessing network connectivity and importance within networks.
(The answer to the earlier question is as follows: Vertex set: Anna, Justin, Alana, Books, Movies. Edge set: {Anna, Books}, {Justin, Anna}, {Justin, Alana}, {Justin, Movies}, {Alana, Movies})
If you are eager to explore graph theory's applications in data science, I recommend my textbook on the subject.
Chapter 2: Exploring Modern Applications of Graph Theory
This video, "Inside An 18th-Century Grand English Manor House | Design Notes," provides insights into historical design principles that may parallel the structured nature of graph theory.